As an online marketing tool, infographics present information in a highly visible format. While keeping that in mind, we discuss producing killer infographics.
According to Venngage: An infographic is a collection of imagery, charts, and minimal text. It gives an easy-to-understand overview of a topic.
For a good background on site design, read these articles:
- Better Online Content Marketing
- Tools for Social Media Marketing
- Build a Social Media Checklist
- Web Design Is a Tricky Business
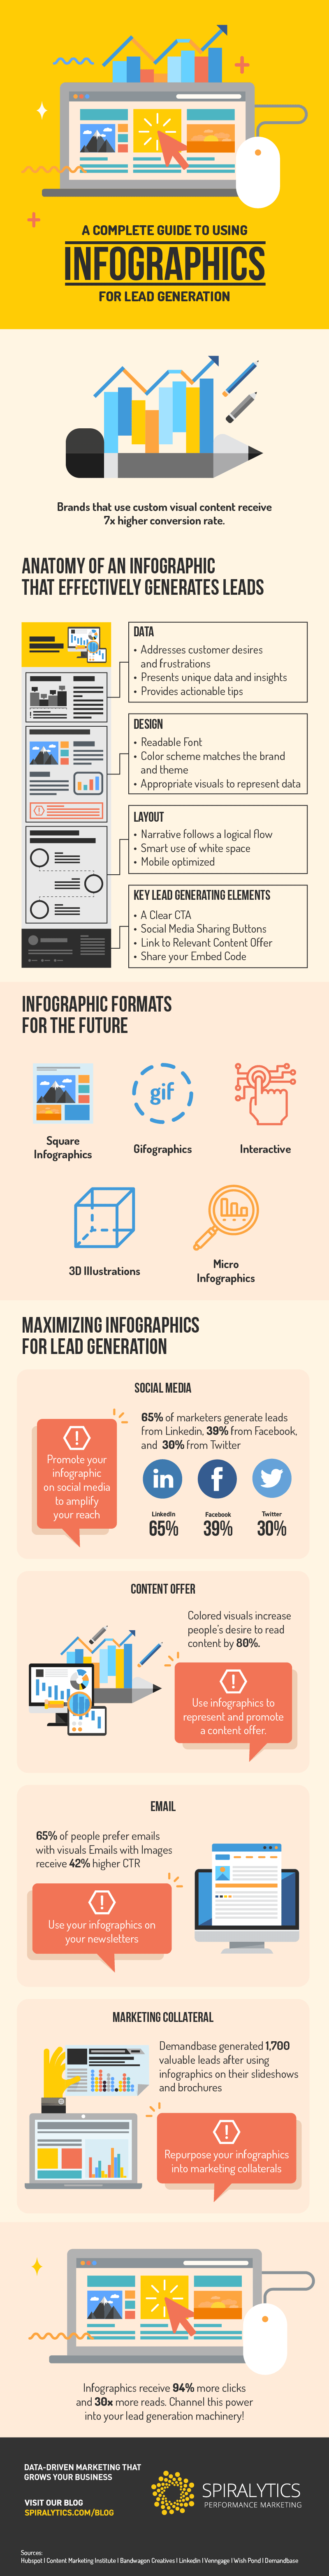
An Infographic About Producing Killer Infographics
When devising infographics, we should follow several tips. To both provide information. As well as to show well visually.
Recently, Ushabelle Bongo reported the following for Spiralytics:
“96% of visitors who come to your Web site aren’t ready to buy yet. Indeed, leads rarely result from the initial visit. So, unless you offer a truly valuable piece of content, they are less likely to give you their contact information.”
“Needless to say, to successfully generate leads with content marketing, your content needs to (1) make a good first impression in a matter of seconds, (2) retain their attention long enough to (3) convince your visitor that the value of the content you’re offering is worth filling out a form.”
Having said that, consider these facts:
-
- First impressions are 94% based on design.
- It takes an average of 50 milliseconds for a new visitor to form a first impression.The brain processes images 60,000 times faster than text
- Visitors who’ve stayed for 30 seconds are more likely to keep clicking.
- Visual content such as infographics receives 94% more clicks and 30 times more reads.”
Now, checkout an informative — you guessed it — infographic.
Visual story telling is critical. Given our attention span and media consumption our retention of information is so limited. Therefore, infographics serve businesses of any kind an opportunity that other content types don’t offer. This post serves to support content creations to ensure their work is moving the needle. A second benefit of infographic material is that it can be broken down into social pieces or described in more detail to serve as blogs. To put it briefly, investing time in delivering a properly developed infographic can support companies in converting readers to action takers.
This is especially helpful for our upcoming presentation. Although it has been recognized before, pictorial information can help people better understand what the presenter wants to show.However, several sets of specific data give me a more specific understanding of the impact of pictorial information.For example: First impressions are 94% based on design. and It takes an average of 50 milliseconds for a new visitor to form a first impression the brain processes images 60,000 times faster than text.
In addition, I also learned that the presentation of specific data can make readers more convinced of the message the article is trying to convey.